Magnum Hunter Resources - A Look At The Value Of Its Land

Summary
Studies have shown that land values are closely tied to oil and gas prices.
Utica Shale realized prices for production are down around 49% from Q1 2015 and 73% from Q2 2014.
This leads to an estimate that the land values are down 75% from mid-2014.
The result is that Magnum Hunter's land may be worth around $569 million if a current valuation was done.
Whether the preferreds and common shares see any recovery depends on when asset valuation is done. In the current market both would likely have no coverage.
 My last report on Magnum Hunter Resources (OTCPK:MHRC) appears to have generated some debate about the value of Magnum Hunter's assets in the current market. I mentioned that I thought it was unlikely that Magnum Hunter could realize $800 million for its land and reserves given the state of the market, and will go into more detail explaining the calculations here. I will say that a lot depends on the state of the market when the asset valuations are determined or the assets are actually sold. If the market is at $50 to $60 oil and $3 natural gas at that time, the reserves and land would probably be able to get significantly more than $800 million. However, at this particular moment, with sub $40 oil and $2 natural gas, asset valuations would be tremendously weak.
Utica Shale Valuation Data Point
In the comments for my last article, some questioned the qualifications of Stout Risius Ross [SRR] to determine oil and gas asset valuations. I believe that SRR's credentials are excellent, and that there wouldn't be any questions about qualifications or focus if the valuation news was more favorable.
In 2012, SRR merged with HFBE, a Houston-based company that specialized in valuations, particularly for energy and real estate. As noted in one of its earlier reports, HFBE was "particularly active in oil and gas company valuations".
The article mentioning Utica Shale acreage values was written by Alan Harp, a Managing Director at SRR who specializes in the valuation of oil and gas interests and entities. The article noted that SRR recently did a valuation on nearly 10,000 net, non-producing acre in the Utica Shale. The conclusion was that the valuation had declined nearly 60% between mid-2014 and mid-2015. Areas such as the Permian Basin have held up significantly better as drilling continues at a fast pace. Although Utica Shale production is still growing, the rig count is less than 1/10th that of the Permian.
An Additional Data Point
As an additional data point, I've found some information from Wood Mackenzie that mentioned that analysis of their extensive M&A database showed that the high end of Utica asset valuations were down 50% by March 2015. Wood Mackenzie also mentioned that core Utica land was worth $10,000 per acre at most then, compared to $20,000 at its peak.
As I will show in the next section, realized prices for Utica Shale production are down nearly 50% versus Q1 2015. Utica Shale land prices have been closely correlated with realized prices for production, so core Utica land may be as low as $5,000 per acre now with non-core Utica Shale land worth even less.
Utica Shale Realized Prices
The bulk of Magnum Hunter's estimated land value (around 70% according to Magnum Hunter's presentation) is in the Utica Shale region. Oil and natural gas prices have come down significantly overall over the past year, but the Utica Shale region has also been affected by a widening natural gas differential.
I've used some numbers from Gulfport Energy (which has production mostly concentrated in the Utica Shale), to show how realized prices have fallen since mid 2014. The blended per BOE number uses Gulfport's Q3 2015 production split of 81% natural gas, 12% NGLs and 7% oil.
In Q1 2015, realized natural gas prices were only $0.10 to $0.15 below Henry Hub. However, by Q3 2015, the differential had widened to around $0.70. This is reflected in Magnum Hunter's results too, where its Appalachian natural gas production had a much larger differential in Q3 2015 compared to Q1 2015. If the differential remains the same now, Gulfport's Utica Shale production may only be getting $1.30 per Mcf at $2 Henry Hub natural gas. Magnum Hunter may be realizing less than $1 per Mcf if differentials are similar to Q3 2015.
Realized Prices |
Q2 2014 |
Q1 2015 |
Dec 2015 |
Oil (Per Barrel) |
$99 |
$42 |
$30 |
NGLs (Per Barrel) |
$48 |
$17 |
$8 |
Natural Gas (Per Mcf) |
$4.43 |
$2.77 |
$1.30 |
Per BOE |
$34.22 |
$18.44 |
$9.38 |
This means that the average realized price per BOE for Utica Shale production is estimated at $9.38 at current natural gas and oil prices, down 49% from Q1 2015 and 73% from Q2 2014.
As noted from the SRR and Wood Mackenzie reports cited above, Utica Shale land prices were down approximately 50% in March 2015 and nearly 60% in mid-2015. Realized prices for Utica Shale production were down 46% in Q1 2015 and 54% in Q2 2015, so the Utica Shale land prices appear to be strongly correlated with the realized prices for its production. Thus, a reasonable estimate would be that Utica Shale land values are currently down 75% from mid-2014 levels.
New Land Value
The net asset value slide doesn't appear to be in Magnum Hunter's most recent presentation. However, the last presentation that included the net asset value slide appeared to have land valuation numbers that were mostly unchanged (increased for Marcellus) compared to its mid-2014 presentations. The midpoint of the land valuation was $2.275 billion.
(click to enlarge)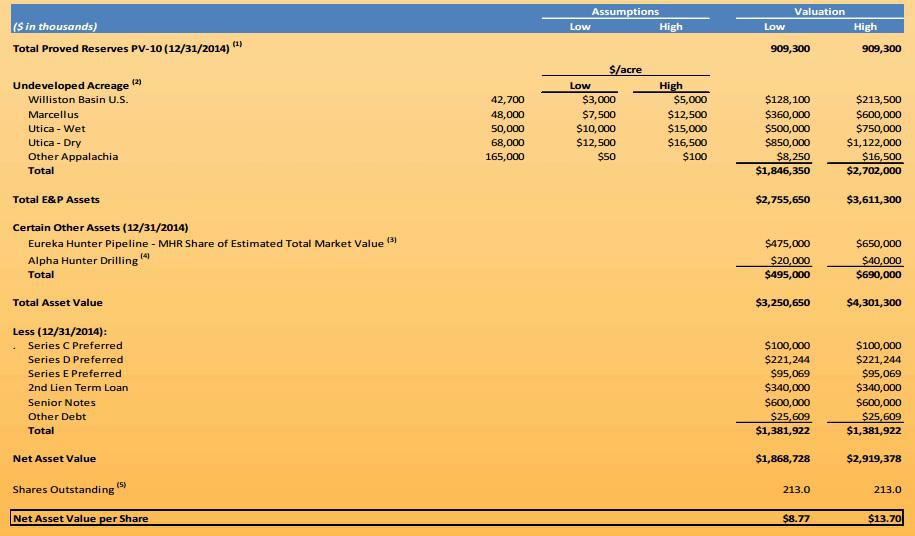
Source: Magnum Hunter
Assuming that Magnum Hunter's land valuation numbers were an accurate reflection of the market in mid-2014, a 75% decrease in land values would bring the new midpoint to $569 million. I assume that the other acreage that Magnum Hunter owns is seeing a similar change in land value as the Utica Shale. As the majority of Magnum Hunter's land value is in the Utica Shale, minor variations in pricing in the other regions will have limited effect.
Expiring Acreage Effect
Another factor to consider is that Magnum Hunter has some undeveloped acreage under leases that will expire within the next few years unless the lease is renewed or becomes held by production. As of January 31, 2015, Magnum Hunter had 248,884 net undeveloped acres under lease in the Appalachian Basin, of which 12% was set to expire in 2016. Most of Magnum Hunter's Williston Basin leases were set to expire by 2017.
Expiring Acreage |
Net Undeveloped Acreage |
2015 |
2016 |
2017 |
2018 |
2019 |
Appalachian Basin |
248,884 |
1% |
12% |
2% |
8% |
16% |
Williston Basin |
27,749 |
47% |
21% |
20% |
6% |
0% |
Other |
546 |
0% |
100% |
0% |
0% |
0% |
Source: Magnum Hunter's 2014 10-K
As per Magnum Hunter's deal with Antero Resources, the price for land with leasehold rights expiring in one to two years was discounted by 50%, while the price for land with leasehold rights expiring in under a year was discounted by 65%.
I am uncertain if any of the expiring 2015 to 2017 acreage ended up being held by production due to 2015 activities. The value of Magnum Hunter's land could be valued at up to 14% less based on 2015 expirations and 2016 and 2017 expiring lease discounts (based on the Antero deal).
Note On Reserve Valuations
Magnum Hunter's reserves had a PV-10 of $909 million with $94.99 oil and $4.31 natural gas. Oil is down around 62% and natural gas is down around 54% from then. If one reduces Magnum Hunter's future cash inflows from the 2014 year-end calculations by 50%, then the future production costs and the future development costs would actually exceed the future cash inflows. One can probably assume some savings on production and development costs, but the PV-10 of the reserves is probably well below $100 million at current prices even with some savings.
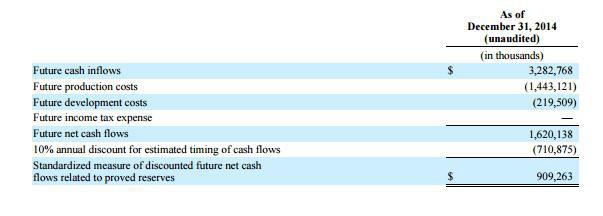
Source: Magnum Hunter 2014 10-K
Perhaps the reserves can be valued at $100 million with some assumed future improvement in oil and natural gas prices. However, it is notable that production, tax and transportation/gathering costs exceeded revenues for Magnum Hunter's production in Q3 2015. I don't think there's much of a market for negative cash flow production.
Timing Of Valuation
A lot depends on the state of the oil and gas markets at the time of the valuation of Magnum Hunter's assets though. If the valuations are done in a period of $55 oil and $3 natural gas and the differentials narrow, it is conceivable that the land goes back to being down only 50% from mid-2014 levels, which would put its potential value at around $1.14 billion. Eureka Hunter's valuation would also be up in that case, and the reserves could be worth a few hundred million again.
It is also true that the valuations estimates I have here are significantly less than what I discussed in October, and that has to do with the large decline in oil and gas prices too. October had $47 oil and $2.50 natural gas. Thus in that market (also with Q2's production costs and differentials), the land was worth around $230 million more, the reserves were worth around $150 million more and Magnum Hunter's Eureka Hunter stake was worth $75 million more. As well, Magnum Hunter's cash burn appeared to be less extreme at the time. A $500 million change in value makes a huge difference to whether the preferreds get some coverage or not.
Before that, I mentioned in a June article that Magnum Hunter's land might be worth $1.15 billion to $1.4 billion. Oil was at $60 then and natural gas was at $2.90 however. As oil and gas prices change, the expectations around land value must also change.
Conclusion
The available data points indicate that Magnum Hunter's land and reserves could be worth around $669 million in the current market. I previously estimated that Eureka Hunter could net $351 million (after the $50 million in CapEx contributions). That wouldn't be enough to cover all of Magnum Hunter's debt. Therefore, the preferred shares would need to hope for market improvements that lead to stronger asset valuations. A restructuring proposal that involved current asset valuations would most likely leave the preferreds out of the money. October prices and valuations probably give the preferreds some coverage, but the common shares would probably need stronger prices to see anything.
Editor's Note: This article covers one or more stocks trading at less than $1 per share and/or with less than a $100 million market cap. Please be aware of the risks associated with these stocks.
Views: 277
Top Content
Latest Activity
- Top News
- Everything
LandownerJim Pollock replied to Jim Pollock's discussion 'Bright Rock Energy to drill a new well' in the group Columbiana County, OH
© 2026 Created by Keith Mauck (Site Publisher).
Powered by
![]()