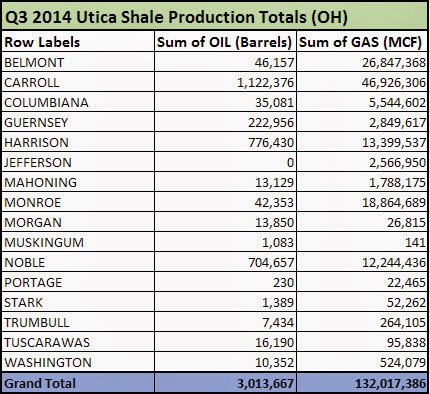
Gas production leaders, top 5 in MCF
Carroll (46,926,306)
Belmont ( 26,847,368)
Monroe (18,864,689)
Harrison (13,399,537)
Noble (12,244,436)
Complete list
 |
| Source: Dec 5. 2014, Ohio DNR data release |
All, just release data from the Ohio DNR.
Top 5 Counties in Oil and Gas production and breakdown by county.
|
| Source: Dec 5. 2014, Ohio DNR data release |
More analysis, maps, and charts to follow.
Views: 5322
Data sourced from here: http://oilandgas.ohiodnr.gov/production
easy read.........using $4 gas and $90 oil........sort and filter
 2014 Q3.xlsx, 121 KB
 Thank you Booger for this work...Very useful in getting some perspective as the cloudy picture begins to clear up somewhat. Now to nail down (somewhat) the type curves....
The holy grail is some reasonable projections of cash flows from the leaseholder point of view.
If anyone has thoughts on discount rates and timeframes (months 72? 120? More? Less?) for net present values and IRR I'd like to revisit that discussion!
I think I got it right. Add three zeros to the numbers for a total production of 1,692,932,000 in 90 days. That's just over 18.8 million cubic feet a day right? The two Whitacre wells are the most impressive for me to see.
....... Marion Township in Noble County is the one to watch, being sandwiched between the GARY wells and the CNX NBL 19 wells; highest gas production in the state to the east and highest oil production to the west (for Q3). The GRAVES, KAHRIG, BARTO, SIBERIANS, DAILEYS and WARNERS should all be monsters! Giddyup Antero!
I would really like it if one of you numbers type people would combine all three quarters on some of these high producing wells and/or the totals for gas and oil for each counties production and then we could all see where the Ohio play stands after nine months of production. Great thanks to the person who will do this.
Something like this?
How the 5 top gas performers in Q1 fared in Q2 and Q3
Utica Shale Production Decline Example
Being a basic math type person I continue to want the overall total of these wells, with a ranking of which one has produced the most mcf's or barrels with the total number of production days. New wells come online each quarter so the quarter rankings don't mean much to me. I am looking for the total output. lol something like who scores the most points on the basketball team.
Ed: Great stuff! Can you add a column to the spreadsheet and divide the gas totals by the days in production to level the playing field...(or basketball court)?
And how about one for Noble County?
Thanks,
Hiker.
ED, Many thanks for the great work; just what I had in mind. Gives me lots of ways to look at all those wells, some are producing very well and don't have much discussion or interest on this site. Thanks, again.
© 2026 Created by Keith Mauck (Site Publisher).
Powered by
![]()